Suggests a alpha opacity to plot with as a function of the number of observation.
Arguments
- n
Number of observations to plot.
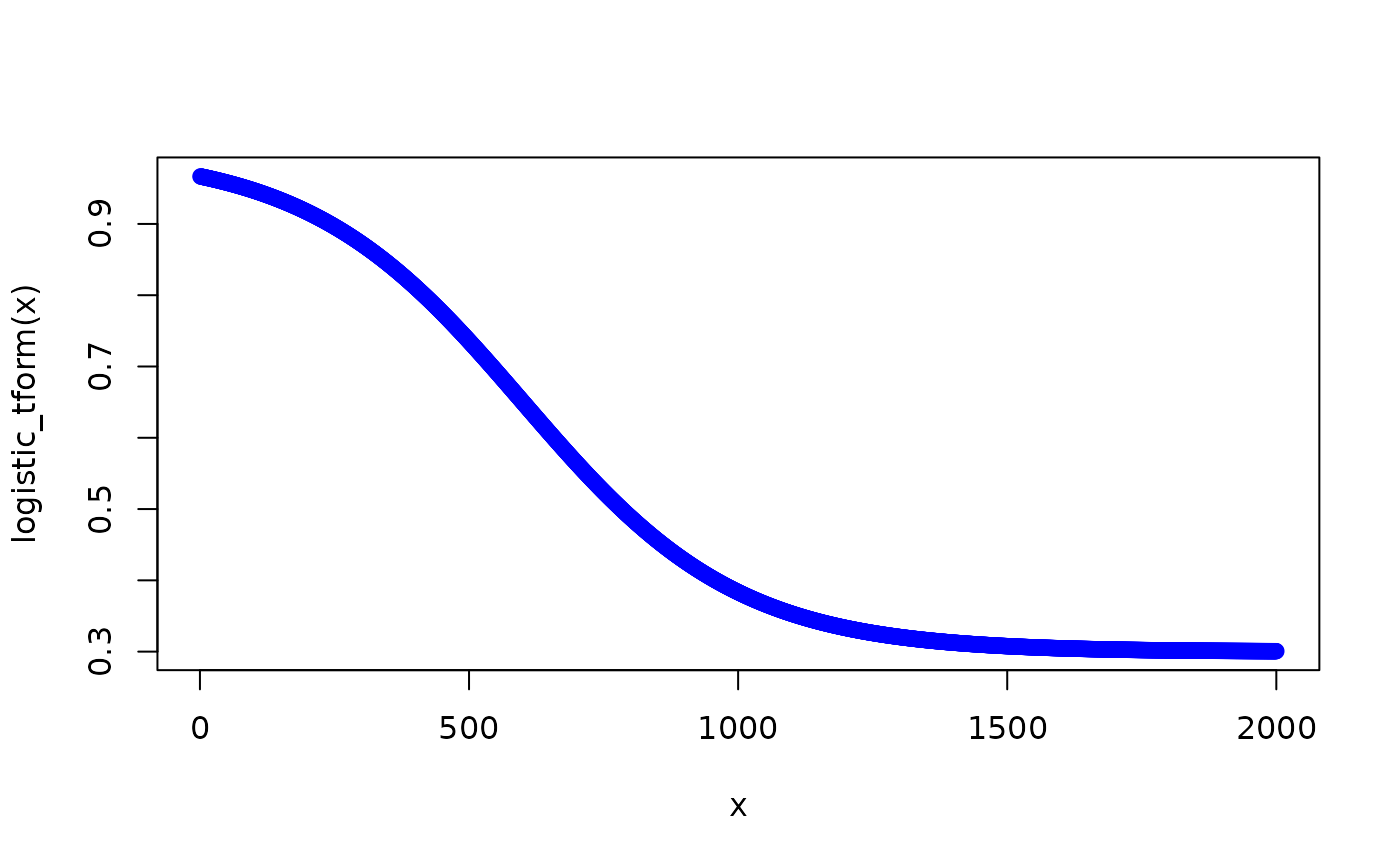
- mid_pt
Inflection point that the logistic curve. Defaults to 600.
- k_attenuation
The steepness of the transition, larger is a sharper transition. Quite sensitive and defaults to 5.
- ceiling
The highest number returned. Defaults to 1.
- floor
The lowest number returned. Defaults to 0.3.
See also
Other cheem utility:
as_logical_index(),
color_scale_of(),
contains_nonnumeric(),
is_discrete(),
is_diverging(),
linear_tform(),
problem_type(),
sug_basis(),
sug_manip_var()
Examples
library(cheem)

## Suggest an opacity to use in plotting:
(my_alpha <- logistic_tform(nrow(spinifex::penguins_na.rm)))
#> [1] 0.8541665

## Visualize
x <- 1:2000
plot(x, logistic_tform(x), col = "blue")