ggtour() initializes a ggplot object for a tour. proto_* functions are
added to the tour, analogous to ggplot() + geom_*. The final tour object is
then animated with animate_plotly() or animate_ggtour(), or passed to
filmstrip() for static plot faceting on frames.
ggtour(
  basis_array,
  data = NULL,
  angle = 0.05,
  basis_label = NULL,
  data_label = NULL,
  do_center_frame = TRUE
)
Arguments
- basis_array
An array of projection bases for the tour, as produced with
manual_tour()ortour::save_history(), or a single basis.- data
Numeric data to project. If left NULL, will check if it data is stored as an attribute of the the
basis_array.- angle
Target angle (radians) for interpolation frames between frames of the
basis_array. Defaults to .05. To opt out of interpolation set to NA or 0.- basis_label
Labels for basis display, a character vector with length equal to the number of variables. Defaults to NULL; 3 character abbreviation from colnames of data or rownames of basis.
- data_label
Labels for
plotlytooltip display. Defaults to the NULL, rownames and/or numbers of data.- do_center_frame
Whether or not to center the mean within each animation frame. Defaults to TRUE.
See also
Other ggtour proto functions:
append_fixed_y(),
facet_wrap_tour(),
proto_basis(),
proto_default(),
proto_density2d(),
proto_density(),
proto_hex(),
proto_highlight(),
proto_hline0(),
proto_origin(),
proto_point(),
proto_text()
Examples
library(spinifex)
dat <- scale_sd(penguins_na.rm[, 1:4])
clas <- penguins_na.rm$species
bas <- basis_pca(dat)
mv <- manip_var_of(bas)
mt_path <- manual_tour(bas, manip_var = mv)
## d = 2 case
ggt <- ggtour(basis_array = mt_path, data = dat, angle = .3) +
proto_default(aes_args = list(color = clas, shape = clas),
identity_args = list(size = 1.5, alpha = .8))
# \donttest{
animate_plotly(ggt)
# }
## Finer control calling individual proto_* functions
ggt <- ggtour(basis_array = mt_path, data = dat, angle = .3) +
proto_point(aes_args = list(color = clas, shape = clas),
identity_args = list(size = 1.5, alpha = .8),
row_index = which(clas == levels(clas)[1])) +
proto_basis(position = "right",
manip_col = "red",
text_size = 7L) +
proto_origin()
# \donttest{
animate_plotly(ggt)
# }
## d = 1 case
bas1d <- basis_pca(dat, d = 1)
mt_path1d <- manual_tour(basis = bas1d, manip_var = mv)
ggt1d <- ggtour(basis_array = mt_path1d, data = dat, angle = .3) +
proto_default1d(aes_args = list(fill= clas, color = clas))
# \donttest{
animate_plotly(ggt1d)
# }
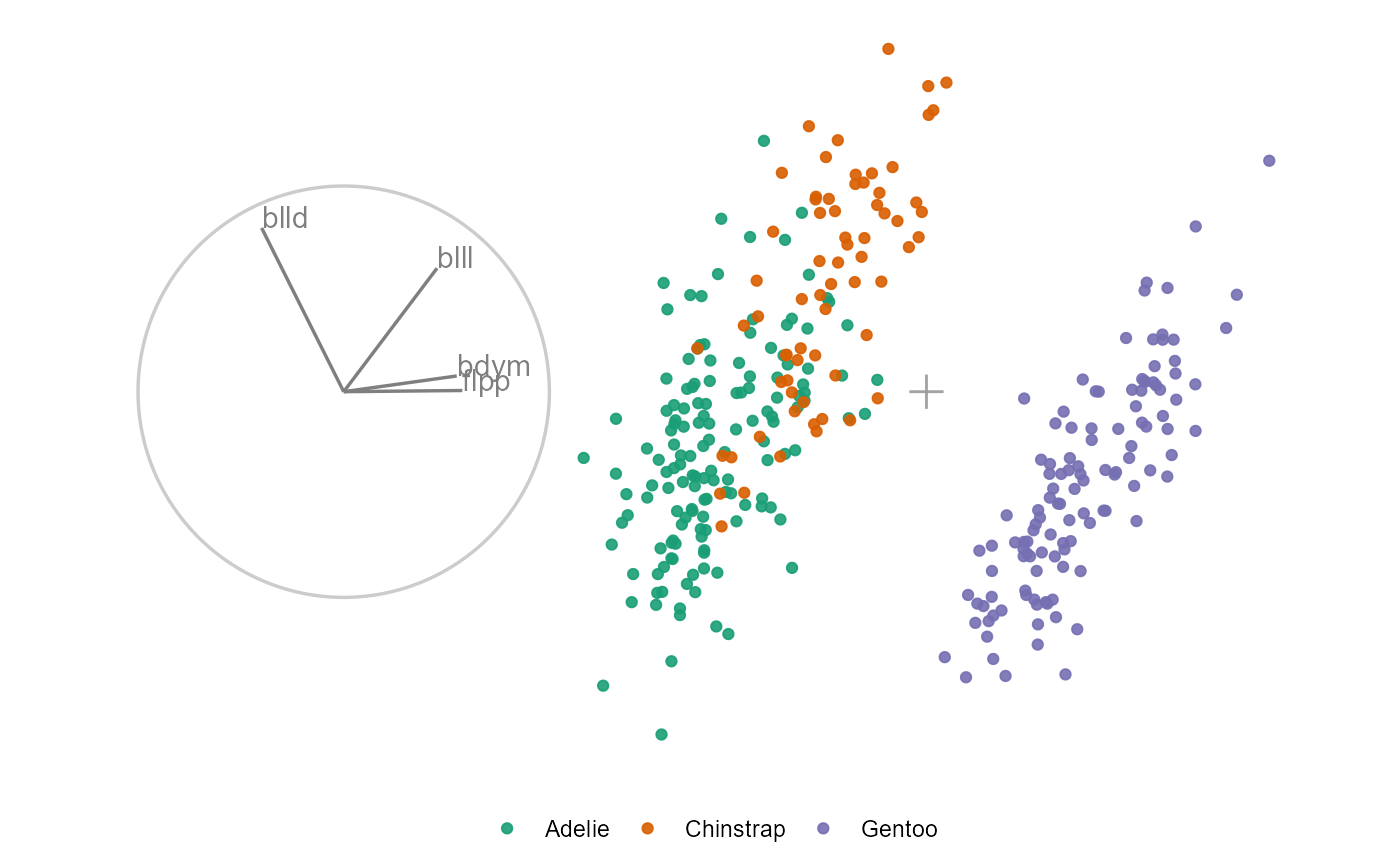
## Single basis
ggt <- ggtour(basis_array = bas, data = dat) +
proto_default(aes_args = list(fill= clas, color = clas))
## ggtour() returns a static ggplot2 plot
# \donttest{
ggt
 ### or as html widget with tooltips
animate_plotly(ggt)
#> ggtour df_basis only has 1 frame, no animation options.
# }
### or as html widget with tooltips
animate_plotly(ggt)
#> ggtour df_basis only has 1 frame, no animation options.
# }