Plot 2D projection frame and return the axes table.
Source:R/zDepricated_3_visualize.r
view_manip_space.RdUses base graphics to plot the circle with axes representing the projection frame. Returns the corresponding table. Only works for 2d manual tours.
view_manip_space(
  basis,
  manip_var,
  tilt = 0.1 * pi,
  basis_label = abbreviate(row.names(basis), 3),
  manip_col = "blue",
  manip_sp_col = "red",
  line_size = 0.6,
  text_size = 4
)
Arguments
- basis
A (p, d) orthonormal numeric matrix. The linear combination the original variables contribute to projection space. Required, no default.
- manip_var
Number of the column/dimension to rotate.
- tilt
angle in radians to rotate the projection plane. Defaults to .1 * pi.
- basis_label
Optional, character vector of
plength, add name to the axes in the frame, defaults to 3 letter abbriviation of the orginal variable names.- manip_col
String of the color to highlight the
manip_var.- manip_sp_col
Color to illustrate the z direction, orthogonal to the projection plane.
- line_size
The size of the lines of the unit circle and variable contributions of the basis. Defaults to 1.
- text_size
The size of the text labels of the variable contributions of the basis. Defaults to 5.
Value
ggplot object of the basis.
Examples
library(spinifex)
dat_std <- scale_sd(wine[, 2:6])
bas <- basis_pca(dat_std)
mv <- manip_var_of(bas)
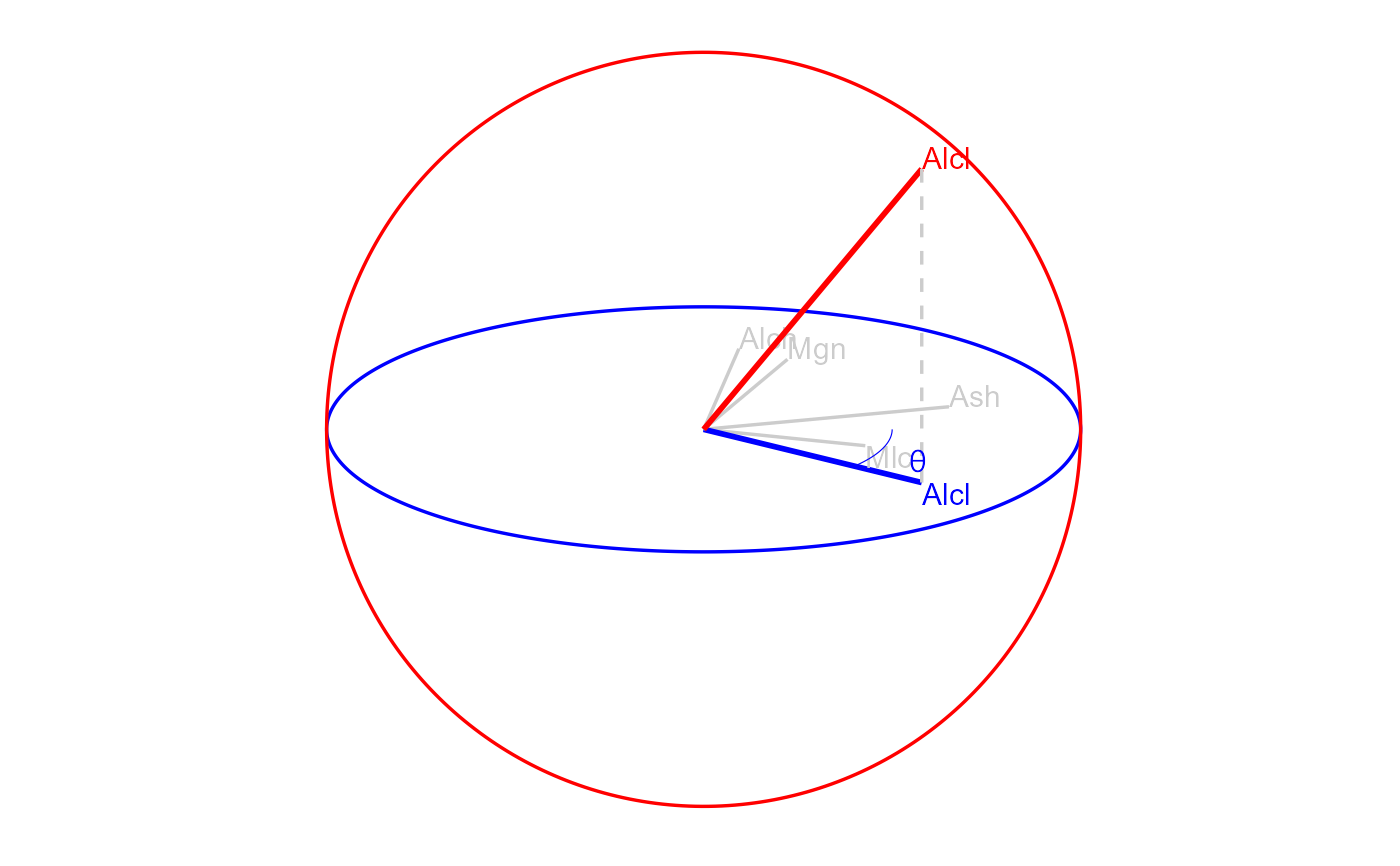
view_manip_space(basis = bas, manip_var = mv)
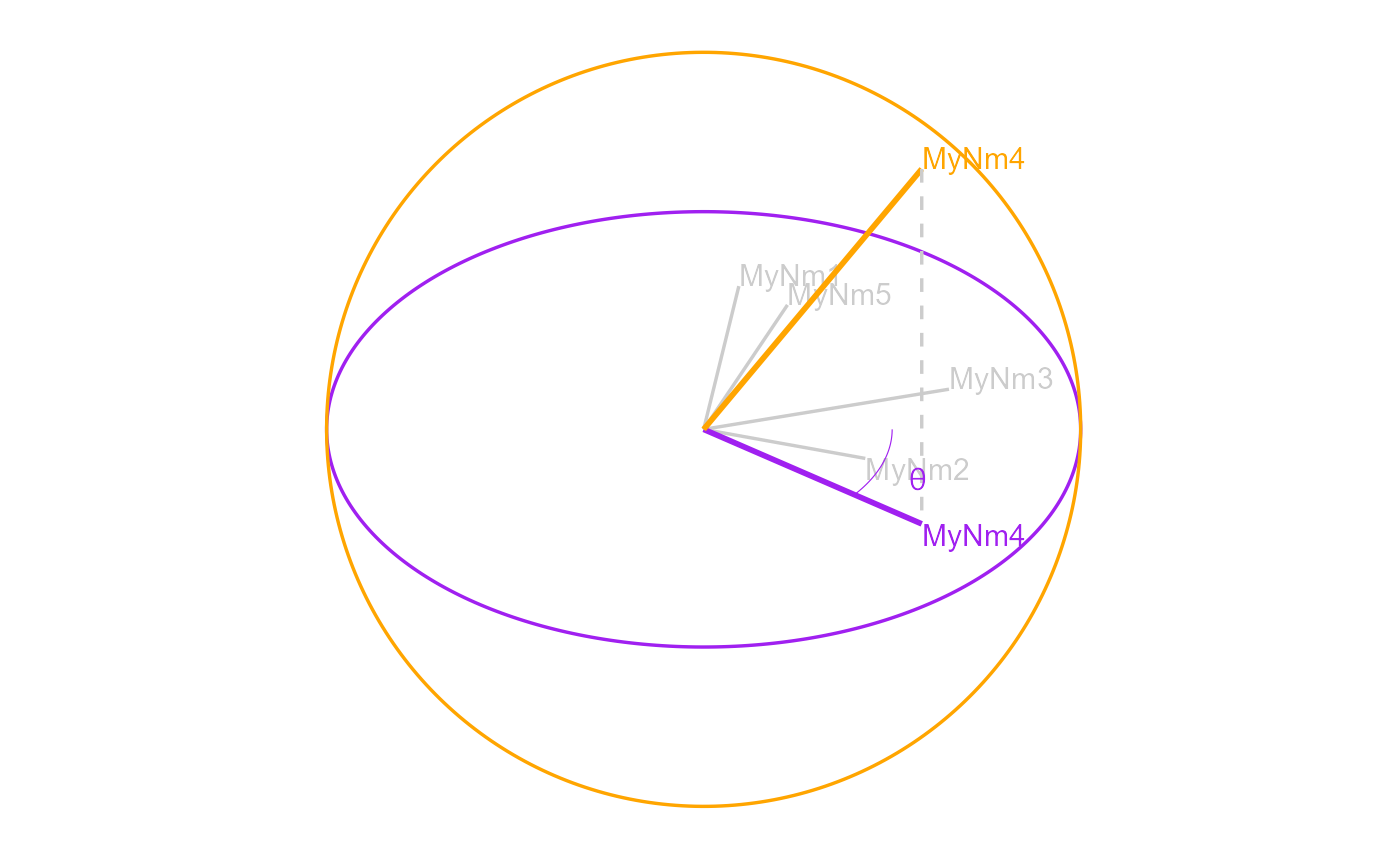
 view_manip_space(basis = bas, manip_var = mv,
tilt = 2/12 * pi, basis_label = paste0("MyNm", 1:ncol(dat_std)),
manip_col = "purple", manip_sp_col = "orange")
view_manip_space(basis = bas, manip_var = mv,
tilt = 2/12 * pi, basis_label = paste0("MyNm", 1:ncol(dat_std)),
manip_col = "purple", manip_sp_col = "orange")